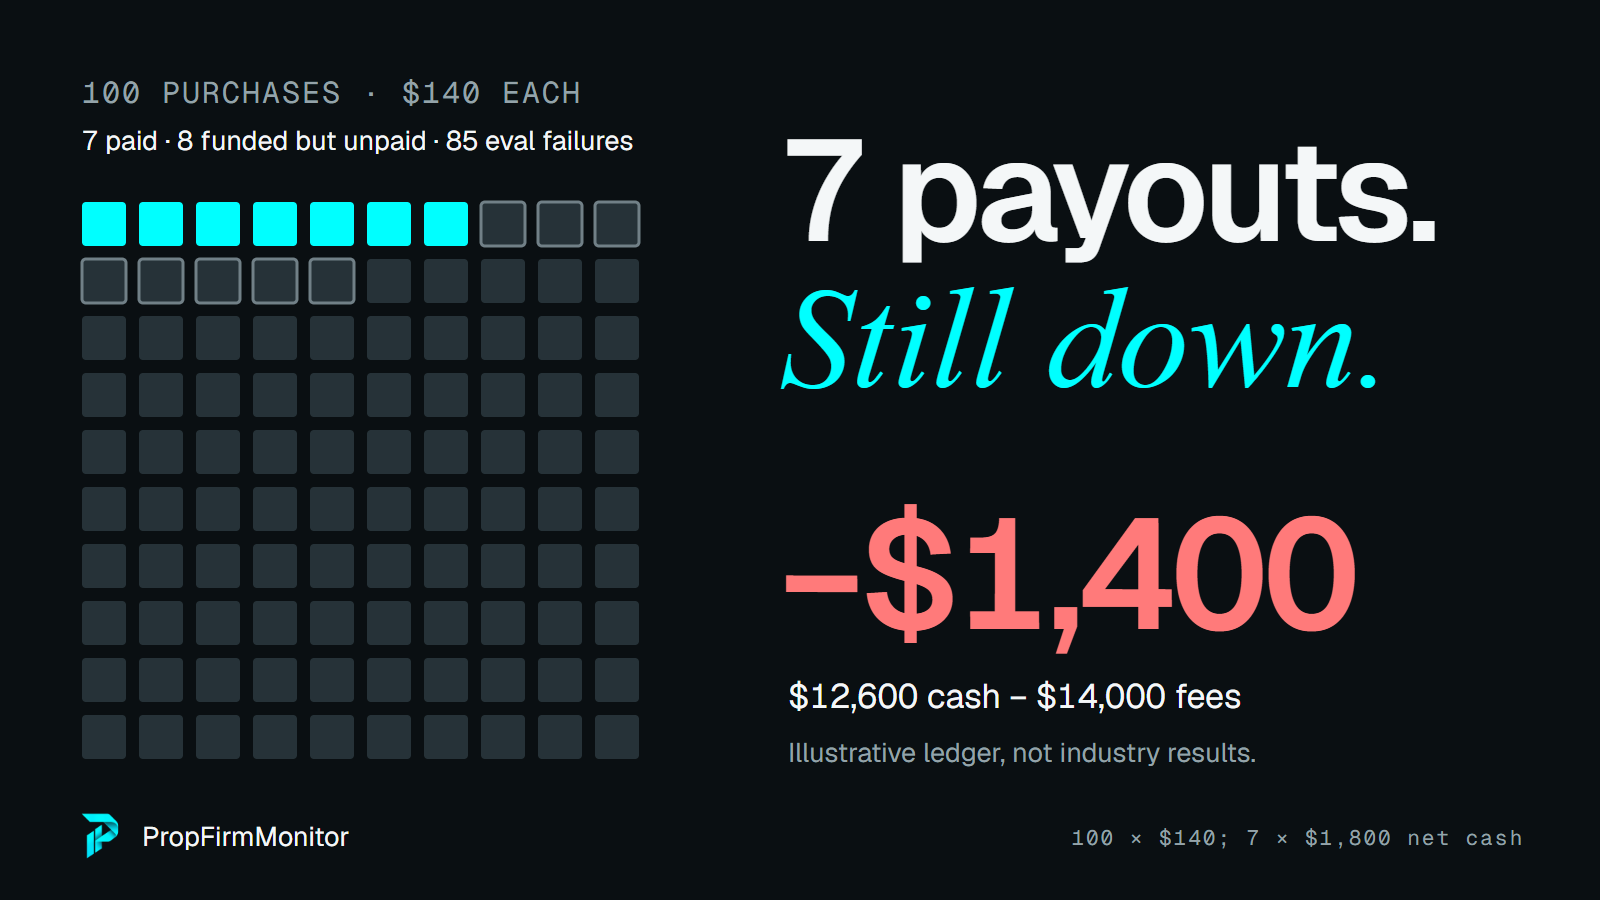
Count the attempts behind the screenshot
You paid for the failed attempts. Our illustrative 100 purchases at $140 produce only $12,600 in cash, so you need the whole ledger before calling the payouts profit.
A payout screenshot shows money received. It rarely shows what the trader spent reaching it. Failed evaluations, resets and unpaid funded accounts still cost money. A useful return calculation starts before the first winning account.
Here is a small example you can redo. These are chosen illustrative counts and prices. They are not industry statistics, a firm’s measured results or an outcome we expect you to achieve.
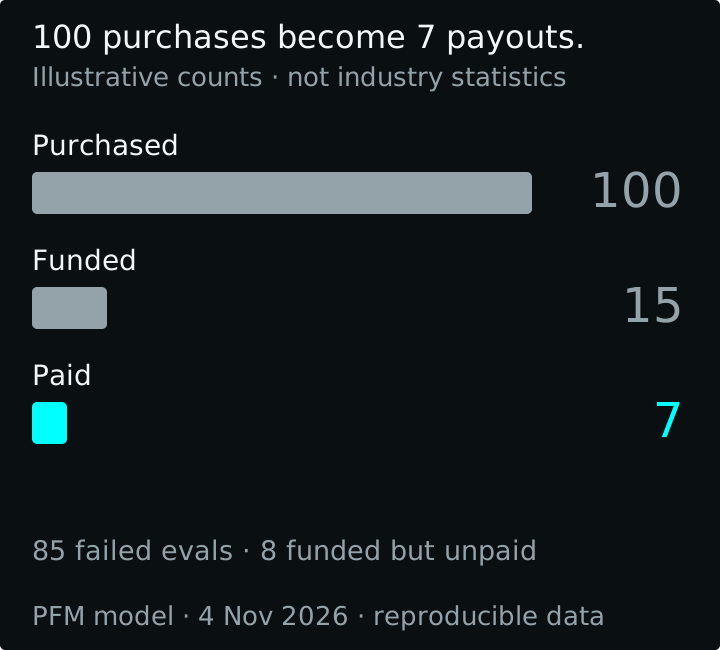
| Stage | Accounts | What counts financially |
|---|---|---|
| Purchased | 100 | Pay a fee for each attempt. |
| Failed before funding | 85 | No payout; purchase fee still counts. |
| Reached funded | 15 | Funding alone is not cash received. |
| Funded but never paid | 8 | No cash received. |
| Received a payout | 7 | Count cash after the firm’s split. |
The funded share is 15.0%. The purchase-to-payout share is 7.0%. Among funded accounts, 46.7% get paid in this illustration. Those are different denominators. Use the purchased-attempt denominator when working out what each purchase returned.
Attach money to the whole group
Suppose each purchase costs $140. The seven paid accounts each receive $1,800 after the firm’s split. For this simple illustration there are no resets, activation charges or other fees, and each paid account has only that one payment.
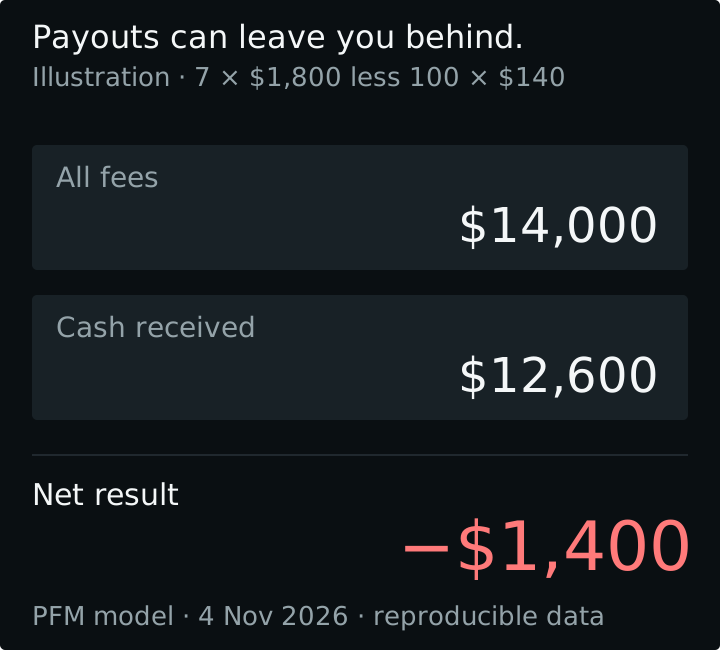
| Item | Calculation | Result |
|---|---|---|
| Purchase fees | 100 × $140 | $14,000 |
| Cash received | 7 × $1,800 | $12,600 |
| Net cash | $12,600 − $14,000 | −$1,400 |
| Net per purchase | −$1,400 ÷ 100 | −$14 |
| Return on fees | −$1,400 ÷ $14,000 | -10% |
Return on fees uses the fees as the denominator. It is not a return on the nominal account size, and it is not an annual return. A funded account label describes the trading arrangement; it does not tell you the amount of cash you own or can withdraw.
Use an actual cash ledger. Record the purchase date, plan, purchase fee, renewal, reset, activation charge, payment fees and every withdrawal received. Apply refunds and credits once. Count the firm’s split once too: either start with net cash received or subtract it from gross rewards, never both.
Work backwards to the break-even hurdle
In this stripped-down example, each purchase brings in an average of $126 in cash while costing $140. To break even at $1,800 per paid account, the required purchase-to-paid share is $140 ÷ $1,800 = 7.8%. In a group of 100 whole accounts, that means at least 8 payouts. They would bring in $14,400 before any extra costs.
That hurdle changes when a paid account sends several withdrawals. Use the mean total cash received over the account’s full life. Do not multiply a first-payout rate by a large lifetime payout number unless they describe the same group and follow-up period.
It also changes when fees continue while you wait. A low monthly headline price can turn expensive over several renewals. A reset may cost less than a new purchase but still adds to the ledger. Model both the cash cost and the time the process ties up.
Use our Funding cost calculator to compare attempts, billing cycles and activation charges. It helps lay out costs. It does not know your chance of passing or getting paid; those inputs need evidence from your own complete record.
Connect the edge to the cash
Win rate and the size of wins and losses create expectancy: the average result of one trade. R is one planned loss, so reward in R makes different trade sizes comparable. Position size controls how much a single result moves the balance. The rulebook decides which trade orders can survive long enough to qualify.
Passing is only one stage. Payout conditions can add winning-day requirements, consistency, withdrawal buffers, caps, payment schedules and review. Each changes when, or whether, trading profit becomes cash in your account. Check the current plan and funded terms separately.
This is a conditional-accounting identity when those numbers describe the same population and time span. It does not assume funding and payouts are independent. In practice, a small or unfinished sample can make both conditional averages unreliable. Do not treat accounts still waiting for payment as proven lifetime zeros.
Track open attempts separately and reconcile completed groups after enough follow-up. If several accounts copy the same trades, their outcomes are linked. Buying more copies does not provide the same new evidence as independent attempts.
Use the trade-order test to inspect the path, the sizing model to inspect the risk, and the rule layers to inspect qualification. For the earlier series, start with the $50K account comparison.
The final test is simple to state: does this strategy, at this size, inside these rules, produce enough actual cash to cover the full process? A payout is a useful milestone. The complete ledger tells you what it cost.
Download the results, simulation code and full method. They include seeds, unresolved runs and sampling intervals. Re-run with your own trade record and actual rules before using the result.
General education, not financial advice. Model results are hypothetical. Rules change; check the firm’s current terms.
