A clean backtest has one trade order
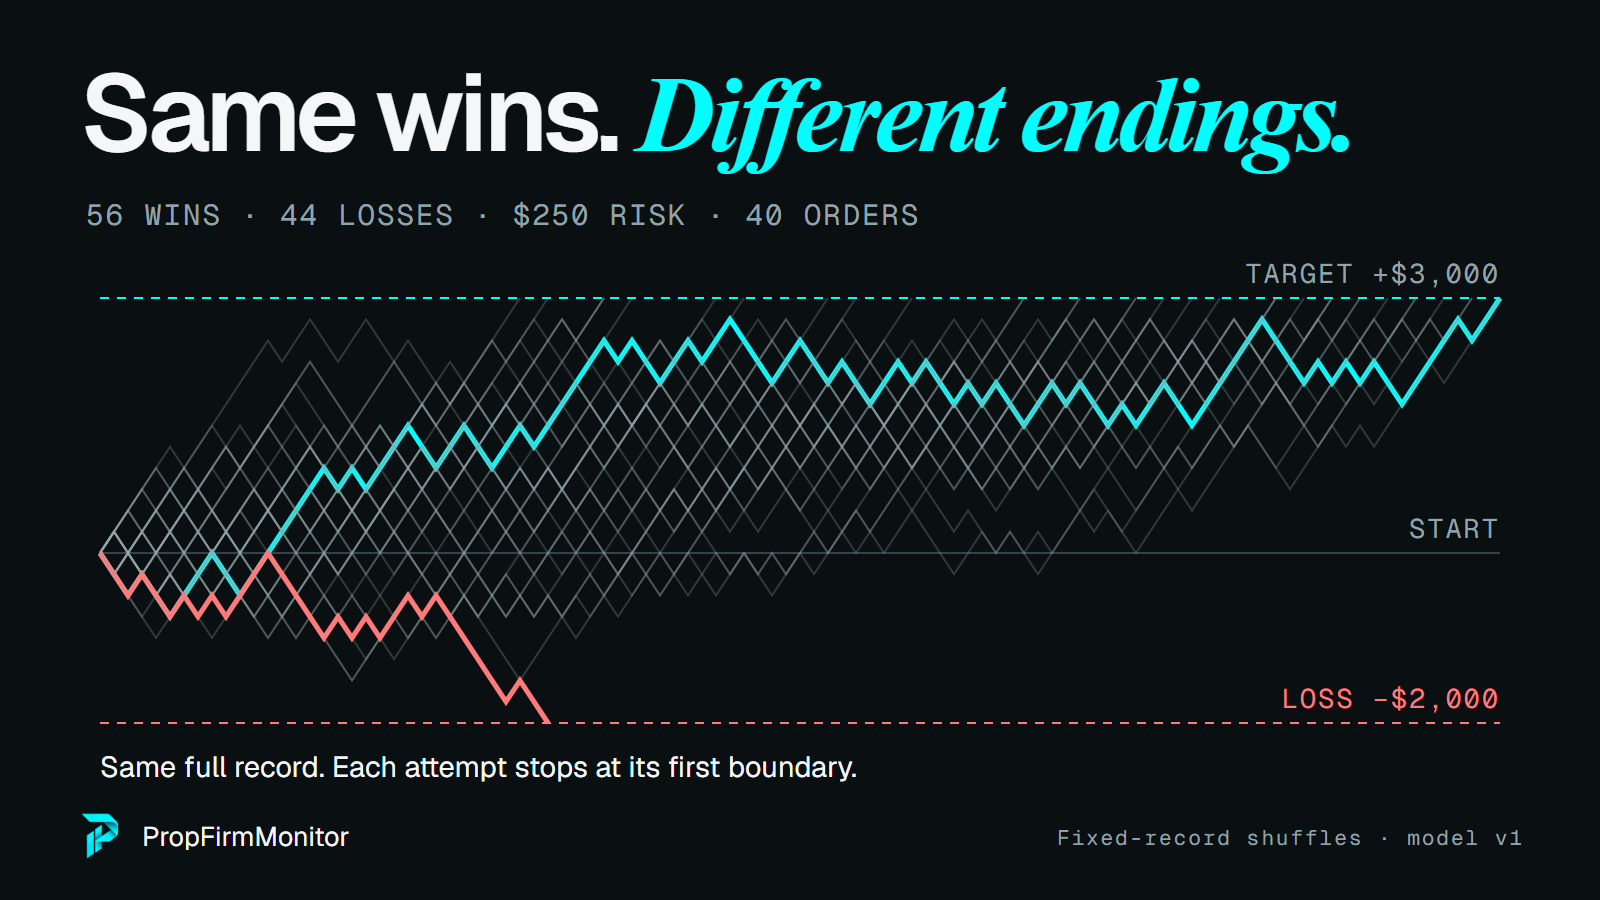
Your backtest shows one possible order. We shuffled 56 wins and 44 losses at $250 risk into 40 paths so you can see which records hit a boundary before the final trade.
A backtest shows how a trading rule would have behaved on past data. Its equity curve is the account balance drawn over time. A smooth line makes risk look manageable. A jumpy line makes it obvious. Both can finish with a profit.
Variance is how widely trade results vary around their average. A strategy that loses often and wins big can make money in bursts. A strategy with more frequent, smaller wins may climb more smoothly. Neither picture tells you whether the next loss streak will fit inside an evaluation.
For this visual, we kept the exact record: 56 wins and 44 losses, each worth +$250 or −$250. We shuffled it into 40 orders. Every complete record ends at +$3,000. The path to that finish changes. The loss floor is static, meaning it stays fixed.
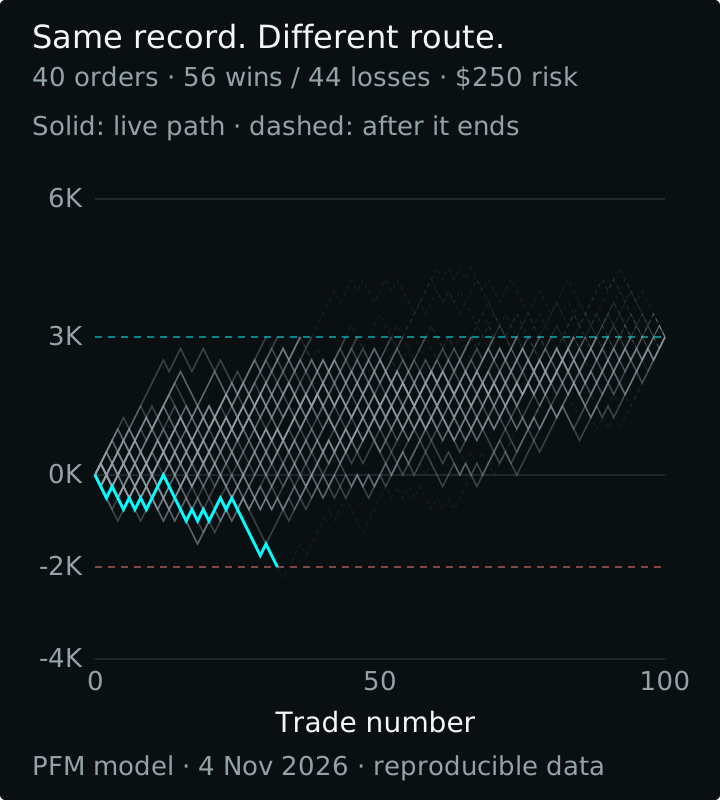
A boundary is the line that ends an attempt. Touch the loss floor first and the account is done, even if later trades would have recovered. This picture is a fixed-record shuffle, not a pass-rate estimate for an independent win-rate model.
The same edge can produce different odds
Expectancy is the average result you would get per trade if the stated win rate and payouts held over many trades. R means the amount you risk on one trade. A +2R win earns twice that amount; a loss here is −1R.
We ran the numbers on a $50,000 reference account: $3,000 target, $2,000 maximum loss, fixed dollar risk, independent wins and losses, and no costs or slippage. Each setting has 24,000 runs. A static loss floor stays fixed. End-of-day (EOD) trailing raises it after a new daily closing high. Our EOD model updates after each five-trade day and locks at the starting balance. This Monte Carlo simulation runs repeated random trade sequences. It is a simplified model, not a measured pass rate at a firm.
| Strategy | Win rate | Win / loss | Expectancy | Static pass | EOD pass |
|---|---|---|---|---|---|
| A | 60% | +1R / −1R | +0.2R | 96.1% | 89.8% |
| B | 50% | +1.4R / −1R | +0.2R | 91.4% | 81.0% |
| C | 40% | +2R / −1R | +0.2R | 80.4% | 67.2% |
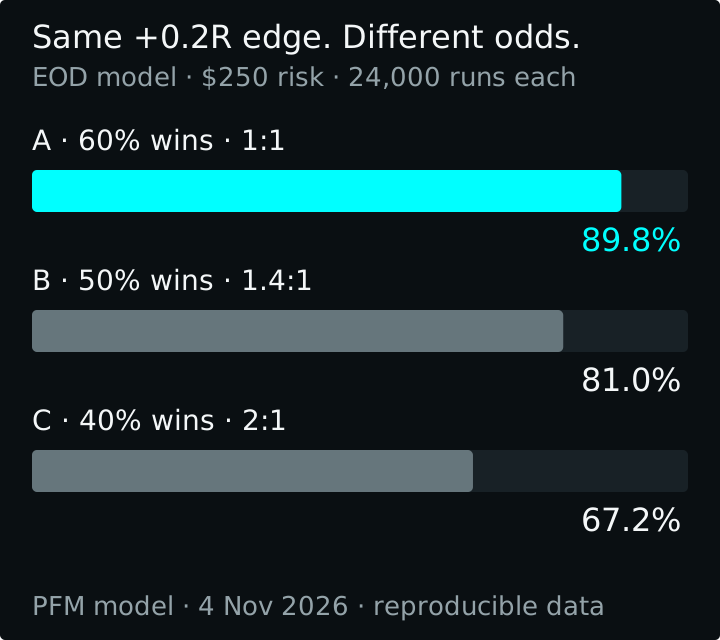
A passes 89.8%, B 81.0% and C 67.2% under the EOD model. C needs larger wins that arrive less often. Some sequences hit the loss floor while waiting for one. An average edge does not say when the wins arrive.
That is the practical split between “can this make money over time?” and “can it hit the target before this loss limit?” A personal account also has capital limits. A prop evaluation adds a contract that ends the attempt at a specific floor.
If a trade-order test keeps failing, try the same setup at a smaller size before deciding the setup itself is broken. Then test again with fees and your actual rules. These dollar boundaries are for our futures example. A Forex evaluation needs its own model.
Five losses are not a rare event over a whole record
For independent trades, the chance that one specified group contains five losses is (1 − win rate) to the fifth power. That is different from the chance of finding a five-loss streak somewhere in a long record.
| Win rate | Specified five-trade group | At least one in 100 trades |
|---|---|---|
| 40% | 7.78% | 97.6% |
| 50% | 3.13% | 81.0% |
| 60% | 1.02% | 45.9% |
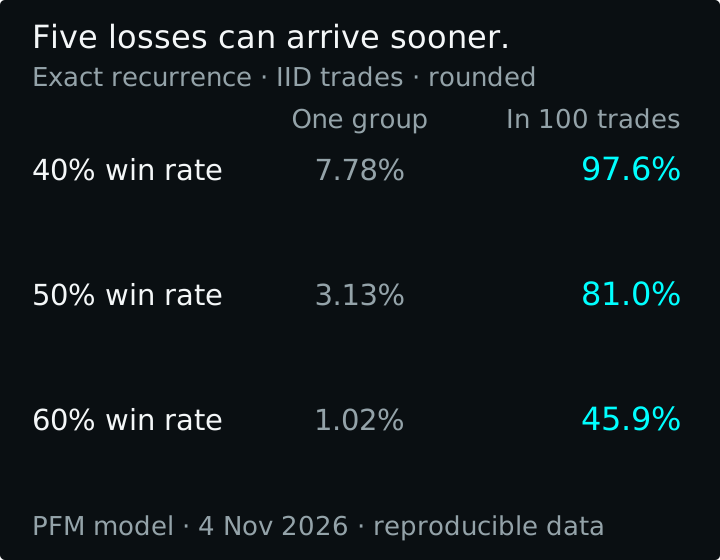
At a 60% win rate, one named five-trade group has only a 1.02% chance of all losses. Across 100 trades, the chance of seeing such a streak somewhere is 45.9%. The overlapping windows matter. You cannot multiply a single-window probability by the number of possible windows and treat that as an exact answer.
Use this to ask whether a routine losing streak fits inside the current buffer. The buffer is the distance from the live balance to the loss floor. It can be far smaller than the account size printed on the plan.
A test you can use before buying
- Record actual wins, losses, costs and daily groupings. Avoid using a win rate guessed from a few trades.
- Shuffle the record to inspect order risk, and use an independent model only when that assumption is defensible.
- Apply the real loss floor, daily limits and qualification rules. Record failure as well as passing.
- Try more than one size. Count time, unresolved attempts and total fees alongside the pass rate.
Continue with risk per trade, the rules stack and the full cost of attempts. For actual approaches, read the $50K eval playbook.
An edge means a positive average result per trade. Real edges can change. Losing trades can cluster, and stops can slip. Our clean model leaves those risks out. A percentage here describes these assumptions; it does not predict your account.
Download the results, simulation code and full method. They include seeds, unresolved runs and sampling intervals. Re-run with your own trade record and actual rules before using the result.
General education, not financial advice. Model results are hypothetical. Rules change; check the firm’s current terms.
